01
Start with a fiscal health overview
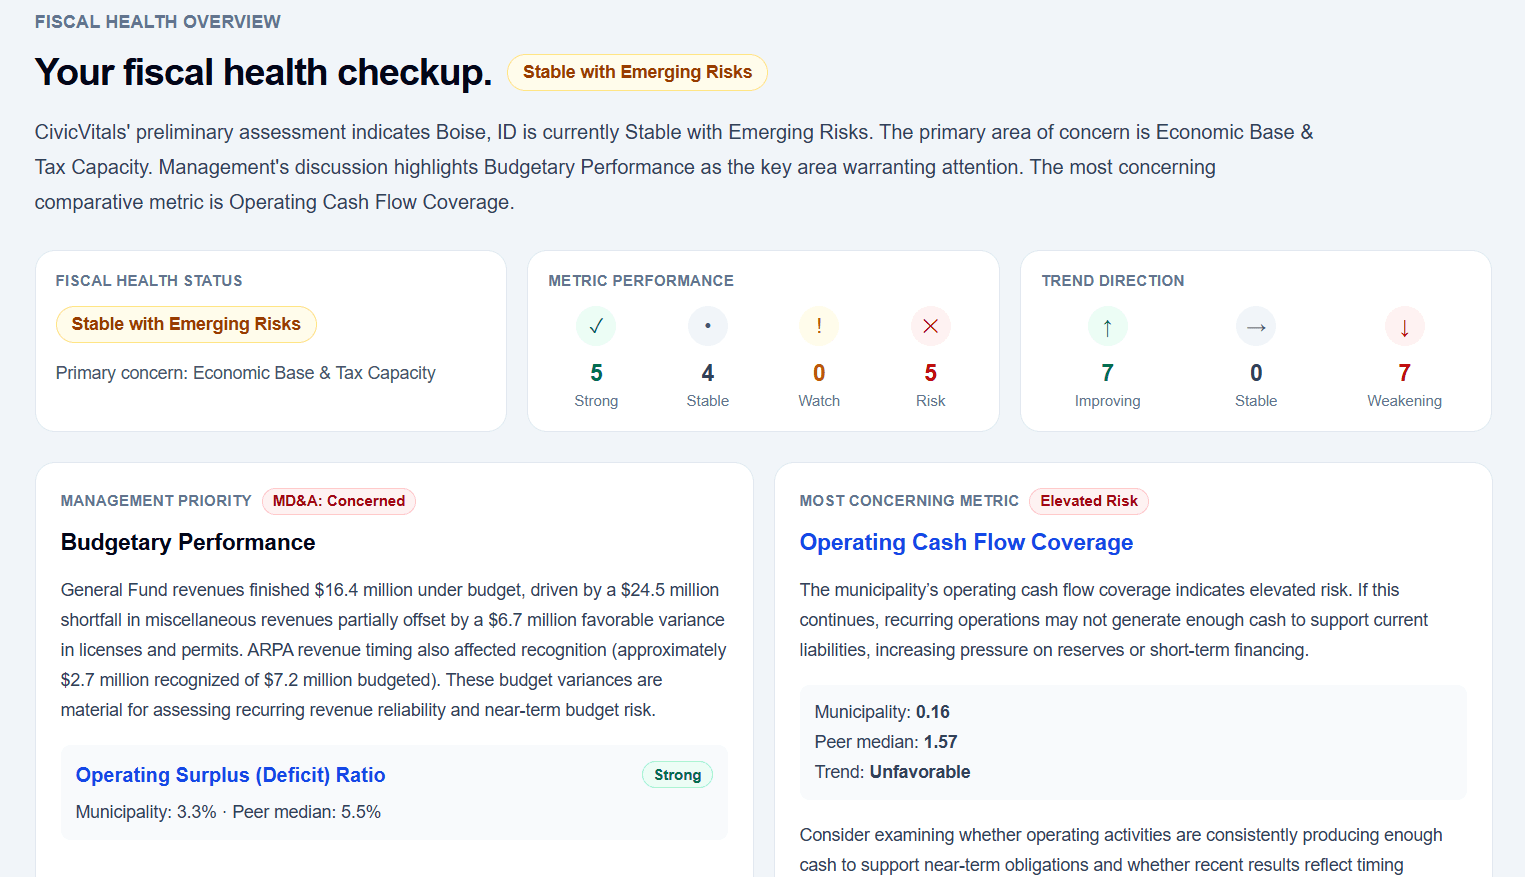
The dashboard brings key financial signals together in one place, helping users quickly identify areas of strength, stability, and emerging concern before reviewing the individual metrics in greater detail.

How it works
CivicVitals transforms municipal annual financial reports into standardized metrics, multi-year trends, peer comparisons, and practical explanations designed to support better financial oversight and decision-making.
The CivicVitals process
CivicVitals organizes reported financial information into a consistent framework so municipal leaders can spend less time assembling data and more time understanding what the results may mean for budgets, services, reserves, debt, and long-term planning.
Relevant financial statement, note, audit, and statistical information is organized into a consistent analytical structure.
Financial metrics are evaluated across time and compared with relevant municipalities to provide meaningful context.
Dashboard explanations translate the results into practical observations, questions, and potential next steps.
Dashboard features
The dashboard is designed to help users begin with a high-level assessment and then explore the individual trends, comparisons, source data, and contextual information supporting that assessment.
01
The dashboard brings key financial signals together in one place, helping users quickly identify areas of strength, stability, and emerging concern before reviewing the individual metrics in greater detail.
02
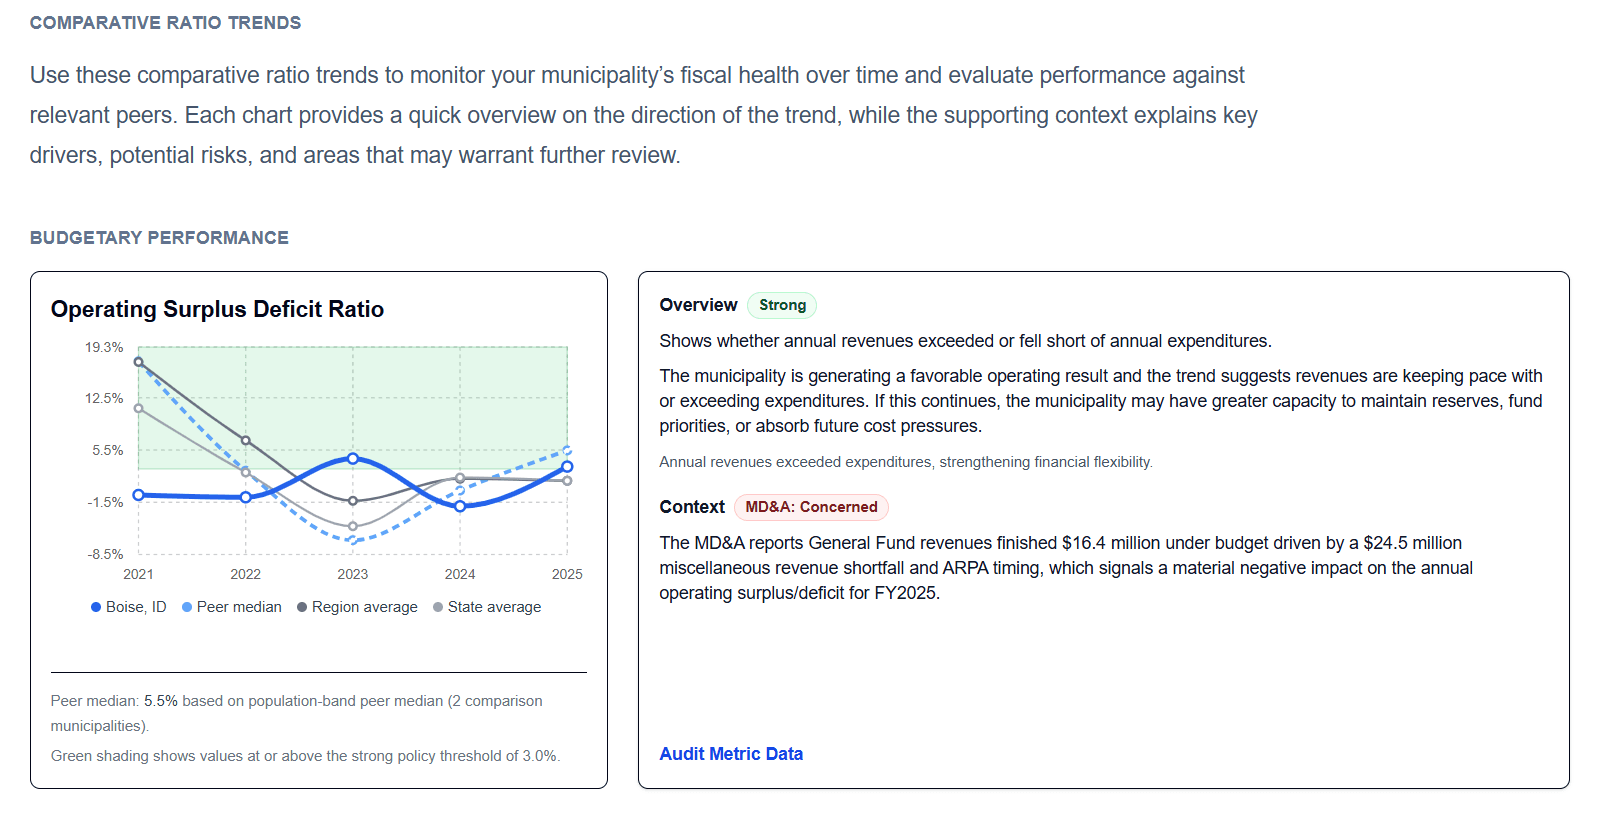
Each financial metric is presented across multiple fiscal years so users can see whether performance is improving, weakening, or remaining stable rather than relying on a single year of results.
03
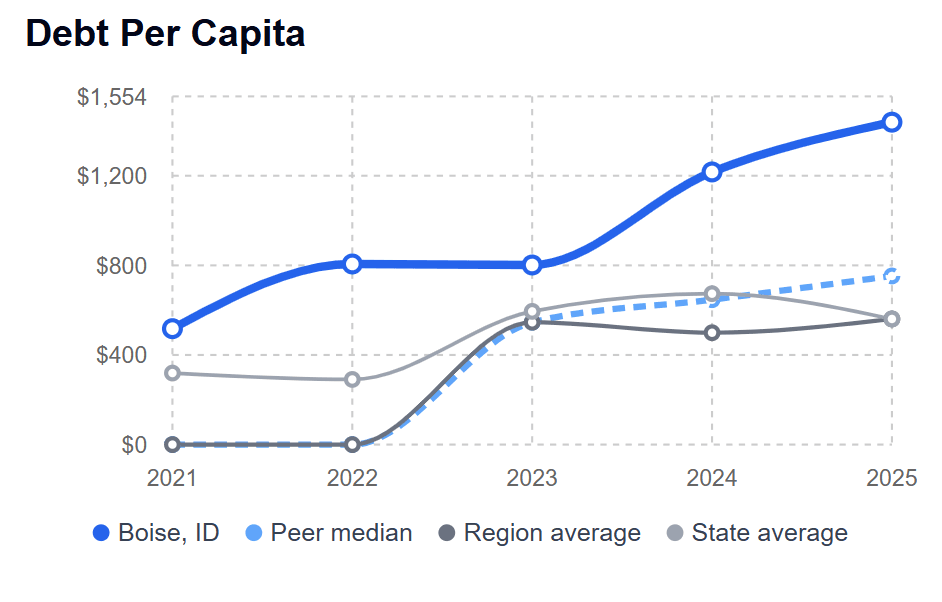
Population-band and regional peer comparisons provide context for each result. This helps users understand whether a financial condition is unique to their municipality or consistent with broader peer trends.
04
Plain-English overview, context, and action-item sections explain why a metric matters, what may be influencing the trend, and which questions municipal leaders may want to explore next.
05
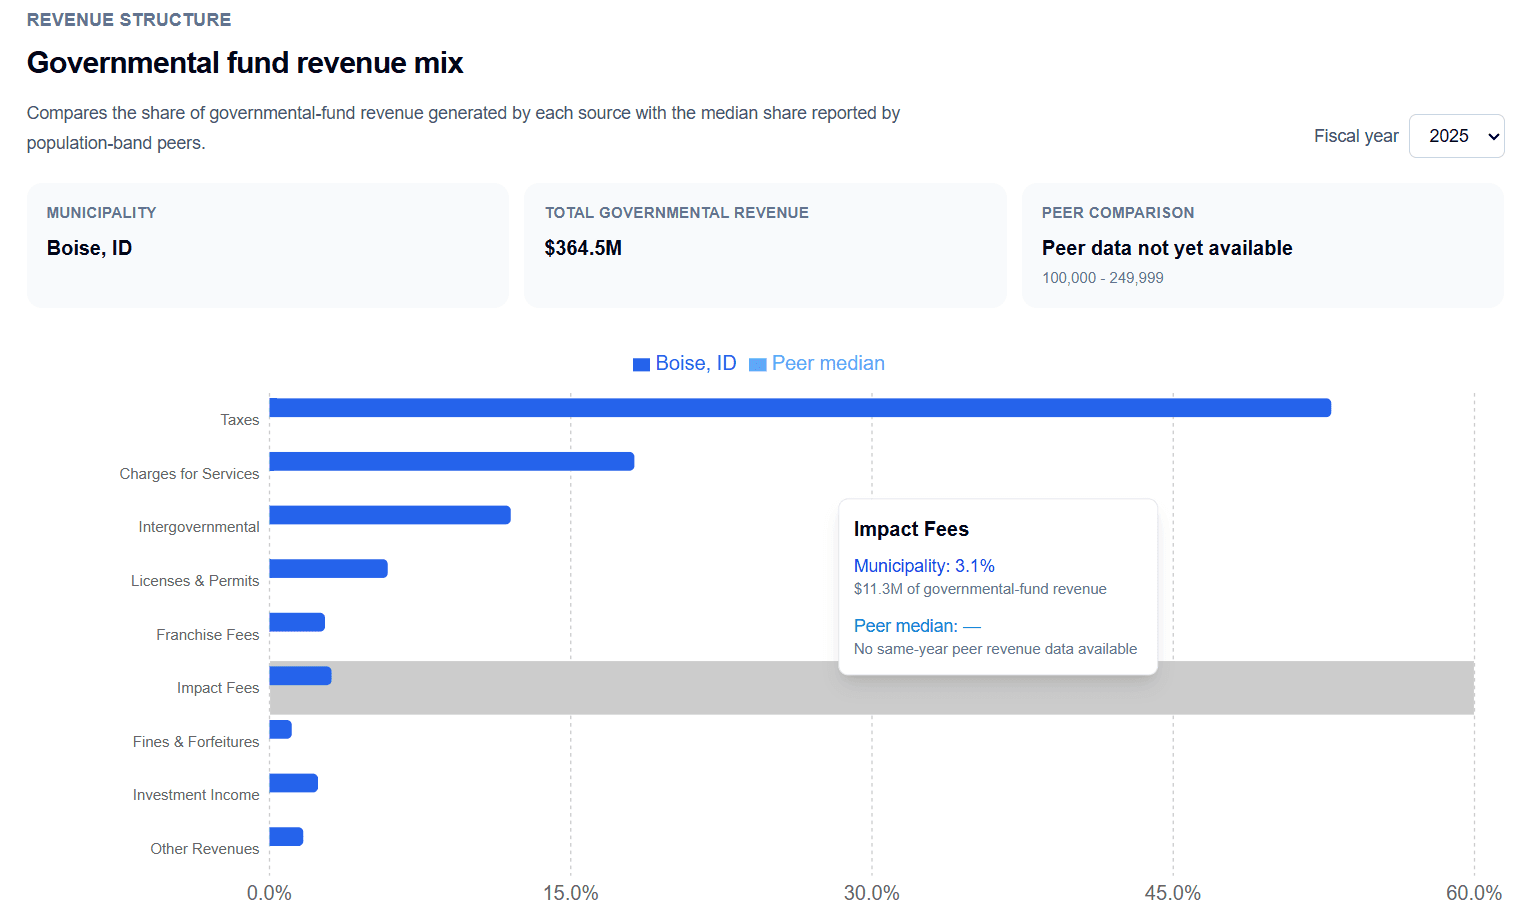
Revenue-source charts show how governmental-fund revenues are distributed across taxes, charges for services, intergovernmental revenues, permits, fees, and other categories.
06
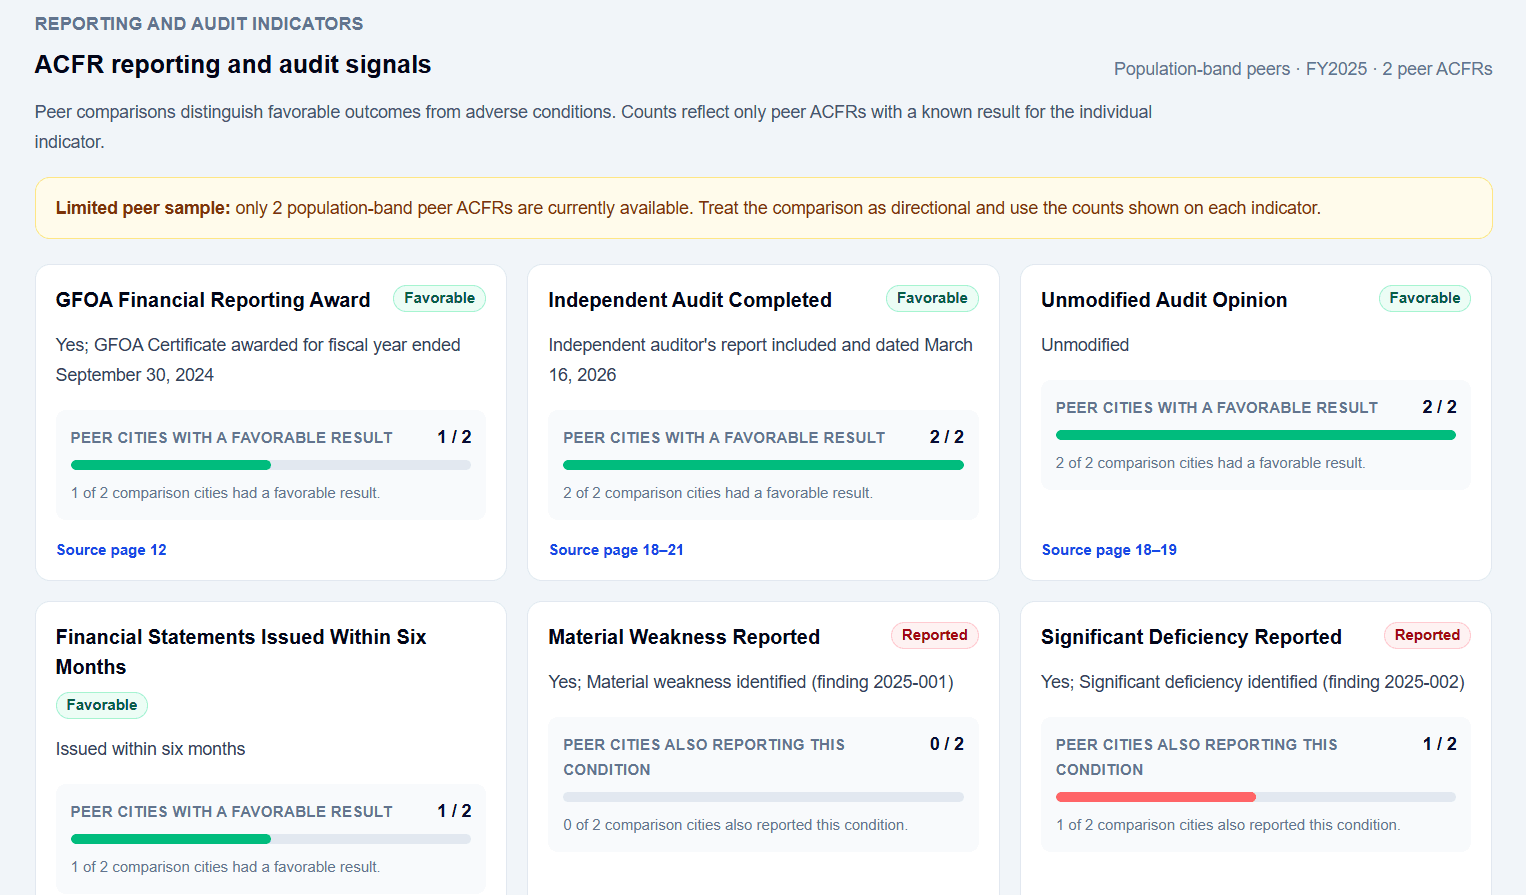
The dashboard also summarizes selected ACFR reporting and audit indicators, including audit opinion, reporting timeliness, internal-control findings, and other signals that may affect financial oversight.
Transparency and verification
Financial analysis is more useful when users can understand the methodology and trace important calculations back to the municipality's published financial information.
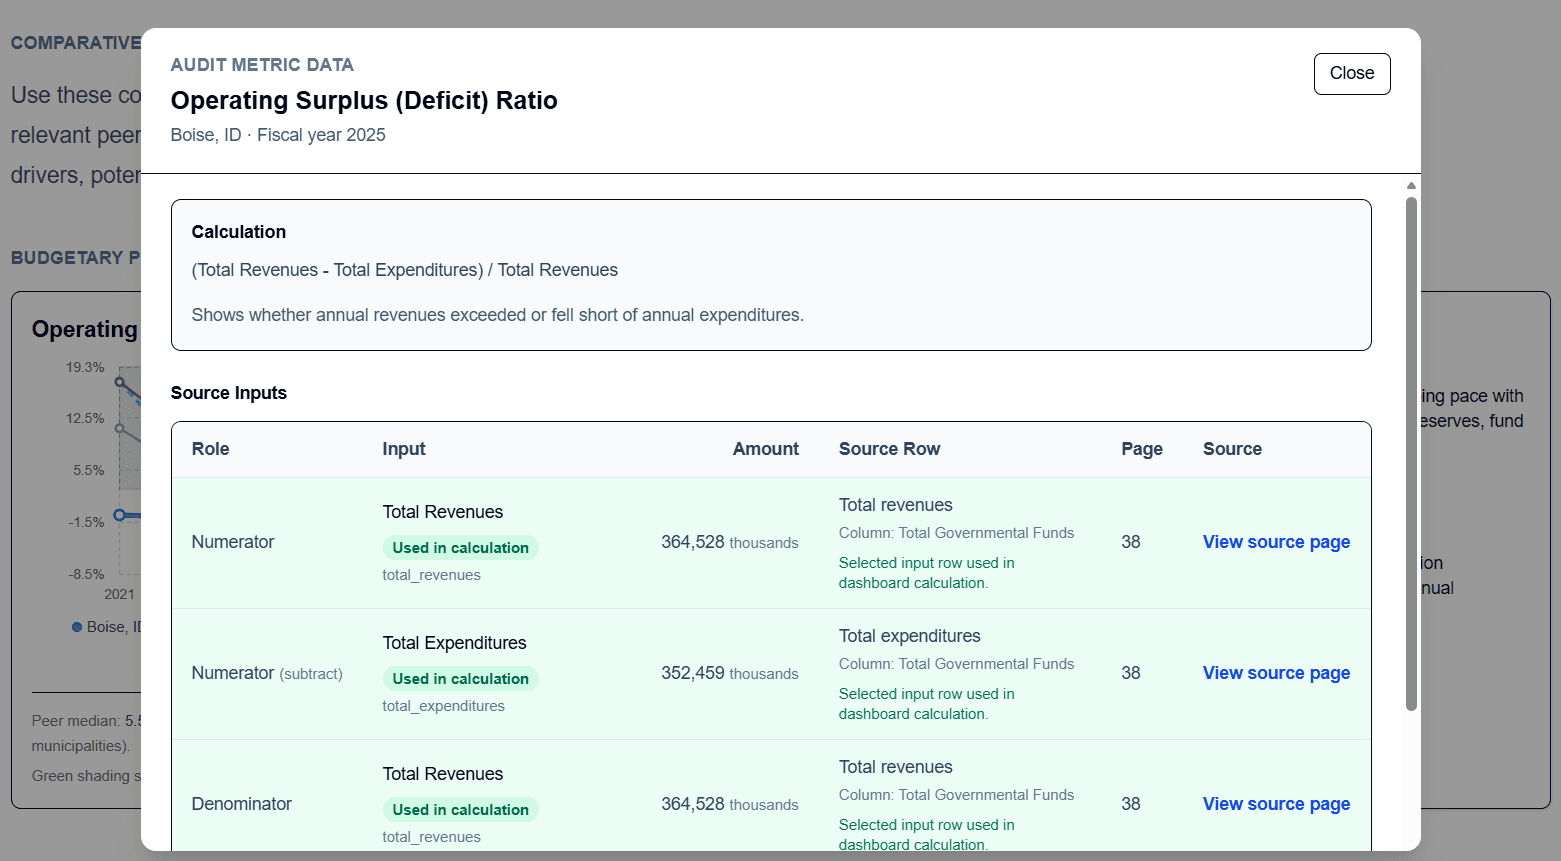
Metric calculations are supported by the underlying ACFR inputs used in the analysis, allowing users to review the reported amounts behind each result.
Where available, links connect dashboard results to the relevant source pages so users can verify the financial statement, note, or statistical schedule used in the analysis.
CivicVitals applies standardized definitions and calculation methods across municipalities to support more reliable year-over-year and peer comparisons.
Learn more
The resources page provides additional information about municipal financial metrics, benchmarking, fiscal-health analysis, and the role of ACFR data in financial decision-making.
It also includes the CivicVitals white paper, which explains how municipalities can move from annual financial reporting to more consistent, comparative, and actionable financial insight.
Featured resource
Review a practical introduction to municipal financial metrics, peer benchmarking, common analytical challenges, and the opportunities created by a more structured financial-intelligence process.
Visit the resources pageGet started
Create an account to request access and begin exploring financial trends, peer comparisons, revenue structure, audit indicators, and source-supported municipal analysis.